1 INTRODUCTION
When planning a commercial photovoltaic system, it is necessary to adapt to local conditions in order to generate the maximum yield at a low cost. First of all, along with the classic system design, it is necessary to decide the direction of alignment for the system.
- 1 INTRODUCTION
- 2 TYPES OF ALIGNMENT
- 3 EAST-WEST SYSTEM CONSTRUCTION
- 4 CHOOSING THE INVERTER
- 5 ENERGY YIELD ACCORDING TO ORIENTATION
- 5.1 Factors influencing the PV yield
- 6 EAST-WEST WITH 1 MPP TRACKER
- 6.1 Lower costs with one MPP tracker
- 6.2 Positive impact on efficiency
- 7 CALCULATION EXAMPLE
- 7.1 Example A: without oversizing
- 7.2 Example B: oversizing of 120%
- 7.3 Example C: Oversizing of 140%
- 8 SIMULATION RESULTS
- 9 CONCLUSION
- 10 APPENDIX
In this document, different system alignments for commercial photovoltaic systems are explained and compared with one another – based on the expected yield and their individual advantages. The east-west orientation in the commercial sector is also discussed in detail: specifically, the impact of implementing east- west systems with a single MPP tracker per inverter.
PV*SOL calculations are used to show that different alignments on one MPP Tracker – such as the classic east-west orientation – have no effect on the total energy yield of the commercial system, but do have many advantages.
2 TYPES OF ALIGNMENT
Commercial photovoltaic systems can be aligned in different directions. The most useful alignments are south, east, or west. Combinations of these three alignments are also possible and commonplace (such as south-east, east-west, south-west).
The east-west alignment makes more room for more power
One common variation is the so-called “east-west system”, where the PV system modules partly face east and partly face west.
This mounting system is a very efficient method, especially on flat roofs, as firstly more can be squeezed onto the roof surface, and secondly, you do not have to worry about the modules themselves potentially casting a shadow. With a south-facing system on the other hand, you have to take into account that modules may be shaded by other modules.
Because of this reciprocal shading in south-facing systems, adopting an east-west orientation allows almost twice as many modules on the roof surface as when mounting them aligned to the south.
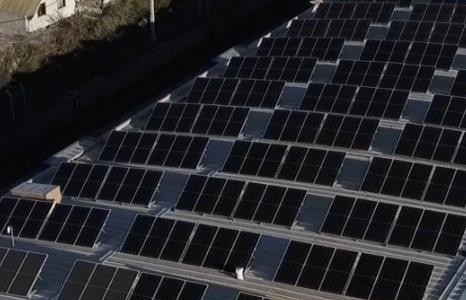
Figure 1: PV modules aligned to the south
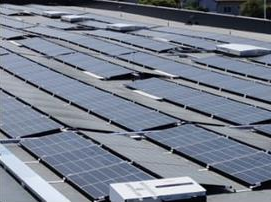
Figure 2: East-west PV module orientation
3 EAST-WEST SYSTEM CONSTRUCTION
An east-west system on a flat roof of a business enterprise usually has row upon row of modules, with a maximum tilt of 10 degrees. There is no need to worry about the modules shading one another, as they are positioned back-to-back. On sloping roofs, such as on a gable roof, modules are conventionally installed “parallel to the roof” in classic module mounting systems, or “integrated into the roof”.
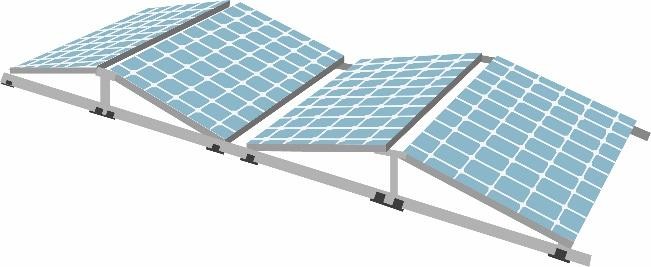
Figure 3: Flat roof mounting arrangement for an east-west system
Mounting PV modules on a flat roof is usually less onerous, because the area exposed to the wind is smaller, meaning that less ballast and fixing are needed than for a south-aligned support system on a flat roof. In many cases, this can also be a crucial deciding factor in opting for this orientation. On older roofs, the additional load caused by the ballast needed for a south-facing system is not always possible for structural reasons, either.
A distinction is made between a centralized and a de-centralized system design for positioning the inverters. Depending on local circumstances, the inverters for the commercial PV system can be placed close to the modules, or close to the distribution box.
4 CHOOSING THE INVERTER
Once the orientation of the commercial PV system has been decided, the main components necessary for the project are defined in principle. The essential element of a PV system is the inverter(s). Once you have decided on the type of Solar inverter, it is necessary to address the question of the power category for each device.
Lower initial costs in an east-west system
The required inverter power category is based primarily on the total generator output of the PV system. There is a fundamental difference between a south and east-west alignment here, however. With an east- west orientation, for example, the same generator output can be achieved using a lower power category inverter than for a south orientation. Considerable cost savings can be made for the project as a result.
The differences in the required power category stem from the maximum power of the inverter. Despite the same generator output, this maximum power varies in accordance with the type of alignment. This is clear to see in a comparison of the PV yield curves for the two alignment types.
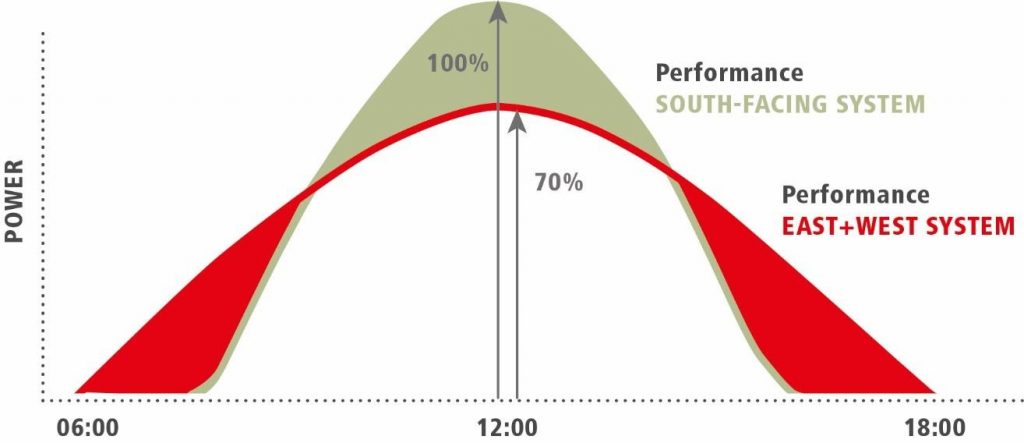
Figure 4: Utilization of inverter capacity in east-west and south-facing systems
In an east-west aligned system, daily production in the PV system begins at first light in the early hours of the morning, increases rapidly, and is typically almost at maximum production by late morning, maintaining this level until the early afternoon. The curve falls again in the late afternoon/evening, but production only stops on the west side late in the evening. This results in a broad, but nevertheless flat PV yield curve.
In a south-aligned PV system on the other hand, production starts somewhat later in the morning, and then rises sharply. A south-facing system tends to briefly record the greatest yield around noon, although this decreases again in the afternoon. South-facing systems typically produce a steeper, but more narrow PV yield curve.
In the south-facing yield curve, the inverter is most frequently called upon around midday, and is utilized at up to 100% capacity for the majority of the time. In the flatter east-west alignment, on the other hand, the
inverter capacity is more evenly utilized throughout the day, with the maximum power never usually reaching 100%. Inverters can therefore be significantly oversized in east-west systems.
Opting for a low power category for the inverters also has a positive effect on the initial cost, which means that the impact on the overall system cost is also positive.
5 ENERGY YIELD ACCORDING TO ORIENTATION
An east-west PV module orientation is possible both on a flat roof and on conventional sloping roofs, and is extremely useful in many cases. In general, an east-west system produces energy for longer throughout the day. As already mentioned, production in an east-west system begins earlier in the morning and stops later in the evening, compared to a south-facing system. This results in a broader, but flatter PV yield curve. A south alignment on the other hand creates a higher but narrower yield curve, because this generates more energy than an east-west system, especially around midday.
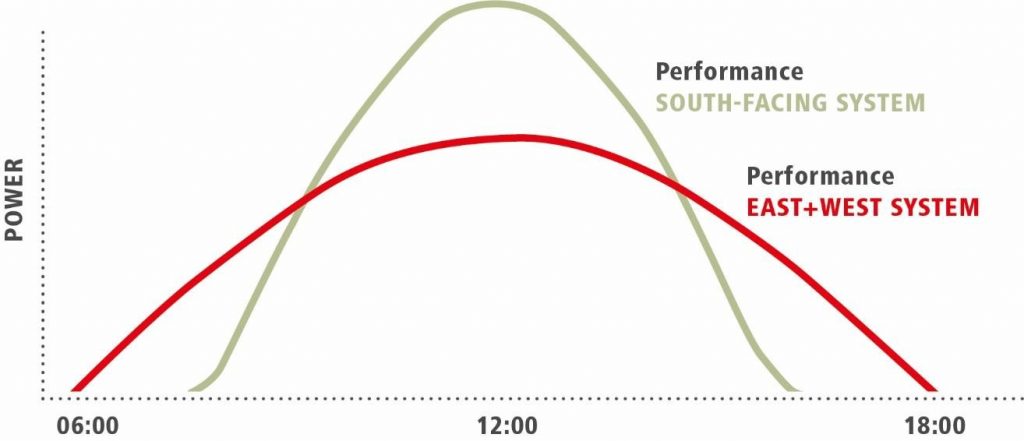
Figure 5: Typical shape of the energy yield curve in relation to the orientation of the PV system
Higher self-consumption in east-west systems
A broad (east/west) PV yield curve is generally a sound basis for a high self-consumption rate, as overall, energy is produced for longer and most importantly, production is more evenly spread throughout the day, which tends to keep the temporary PV surplus to a minimum. As a result, companies that rely on an east- west system orientation for their PV system benefit from a high self-consumption rate. The higher the self- consumption, the faster the investment in the PV system pays for itself.
If you compare the two alignment types on the basis of the expected yield, and assuming the same generator output, a south-facing system usually generates more than an east-west system.
But: If you look at the respective proportions of roof surface being used in each case, east-west orientations will always achieve a better yield than south alignments, as the roof surface can be used more efficiently, and more PV modules can be installed. In turn, more PV modules mean that the PV generator itself is larger. The larger the PV generator, the greater the anticipated PV yield.
The utilization of the individual inverters is also usually higher in an east-west system, as the alignment in two directions reduces the peak load. This means firstly, better utilization of inverter capacity, and secondly, operating the inverter in a better efficiency range. Most inverters are at their most efficient if they are not operating at full capacity.
5.1 Factors influencing the PV yield
The energy yield of a PV system basically depends on the different, external factors acting on the PV modules. These include the outside temperature, the insolation, and the use of an MPP solar tracker with the inverters.
Effect of temperature
The ambient temperature has a major effect on the PV modules and thus on the PV yield. High temperatures have a negative effect on the PV yield, as is obvious from the graphic below.
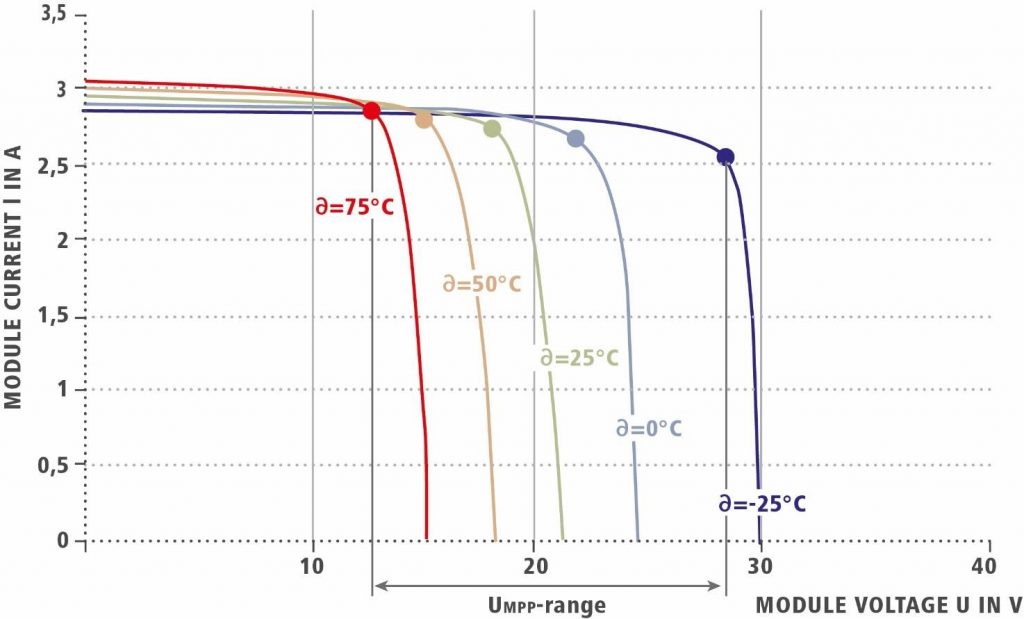
Figure 6. Energy yield in relation to outside temperature
As you can see, the temperature primarily affects the voltage (V), not the current (A). The higher the temperature, the lower the voltage. In an east-west system, this effect would be indirectly proportional. In the morning, the first rays of sunlight on the east side cause the temperature to rise, which causes a drop in module array voltage. On the west side, on the other hand, the temperatures in the shade are even lower, which causes the voltage to rise. On the shaded side, so the voltage is higher, but the power on the shaded side is still low due to the lack of solar radiation. For this reason, the inverter sets the optimal operating point to the east modules in the sun. On the shaded west side, however, no significant losses occur, even though they are not in the ideal operating point.
Effect of insolation
Along with outside temperature, direct insolation has the most influence on the PV modules, and thus on the PV yield. The direct insolation on the module array differs, depending on the location, time of day, and weather conditions. The more intense the irradiance, the higher the anticipated PV yield.
The graphic below shows a module characteristic diagram in relation to insolation.
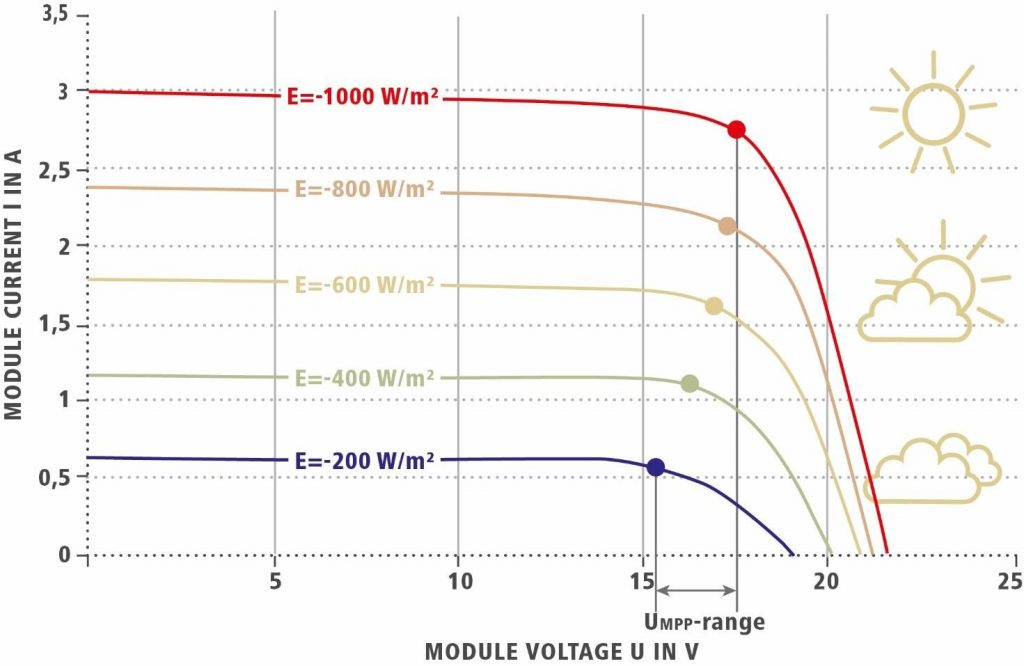
Figure 7: Energy yield in relation to insolation intensity
It is easy to see that the voltage level is high, even when there is little sunlight. This only changes slightly right up to maximum irradiance, as irradiance primarily affects current (A) and not voltage (V) – as is the case with temperature.
This effect impacts positively on an east-west orientation, because if sunlight is already present on the east side in the morning, the voltage level is nevertheless similar to that on the west side. The resultant mismatch losses are therefore marginal and can be ignored.
Effect of module tilt
Due to the major impact insolation has on the total energy yield of a PV system, the tilt angle chosen for the PV modules should be one that makes optimum irradiance possible. The ideal tilt angle differs according to alignment and location.
The graphic below contains an energy yield diagram. This shows that in the location chosen as an example1, the ideal orientation would be south facing with a tilt of almost 30° (black dotted line) in the horizontal plane. You can also see that with an east-west orientation on a flat roof with a tilt of 10°, it is still possible to achieve almost 95% of the maximum irradiance on the PV module (dark orange area). The blue dot represents the west part of the east-west system, the black dot the east part.
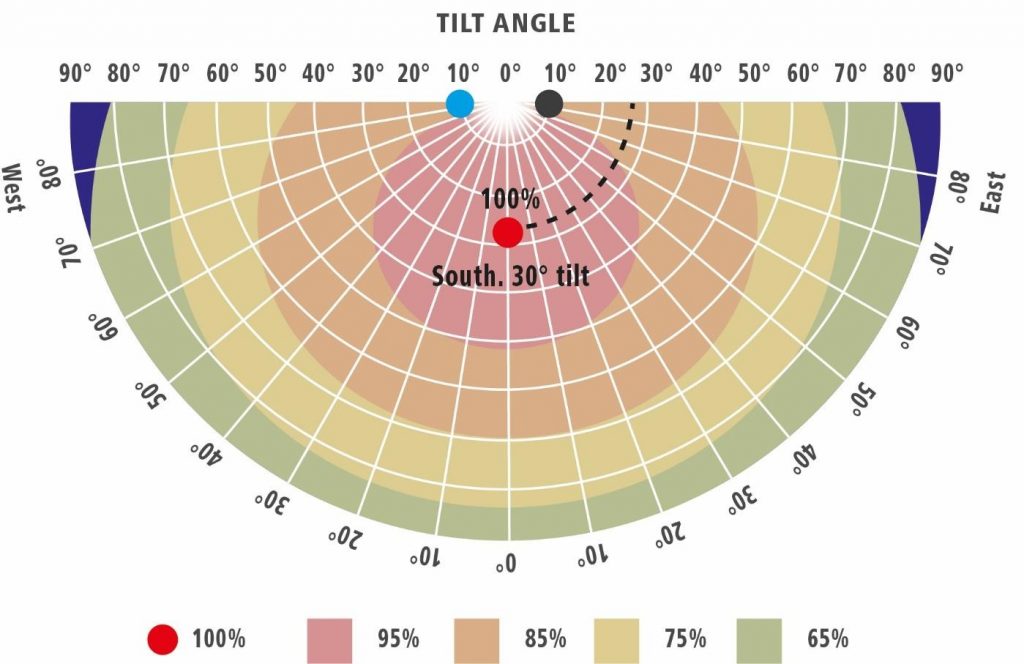
Figure 8: Energy yield diagram for Austria, based on average annual yield
This means that theoretically, compared to an ideal tilt angle in a south-facing system, there is around 5% less usable energy from the individual modules. Knowing that with an east-west orientation, it is possible to install almost twice as many modules on the roof, it means that in practice, although the PV generator is larger, more yield can ultimately be generated than with a south alignment.
The MPP solar tracker effect
As already mentioned, temperature and irradiance have an effect on the current and voltage levels of the module array. This influences in turn the so-called MPP solar tracker. The objective for an inverter’s MPP solar tracker is to ensure that the PV generator always works at the optimum operating point. The optimum operating point is the point at which the generator output is at its maximum.
As the graphic below demonstrates, variations in irradiance in the upper range (500W/m²-1000W/m²) usually have very minimal or no effect on the voltage of the MPP. The MPP only moves to a lower voltage range when the irradiance is 300W/m² or less.
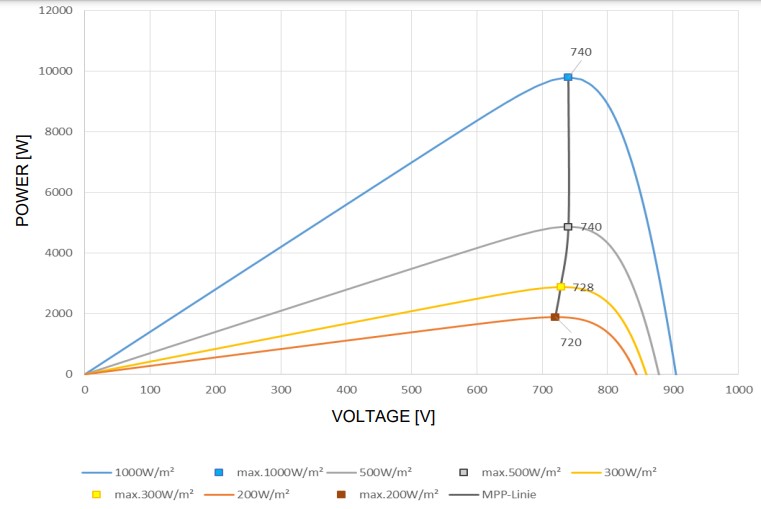
Figure 9: Optimum operating point in relation to irradiance
The graphic shows a number of typical string characteristics with the varying irradiance parameter. The less irradiance there is, the flatter the string curve. The flatter the yield curve, the less energy is produced.
6 EAST-WEST WITH 1 MPP TRACKER
If two strings with different orientations are connected to one MPP tracker, the inverter looks for the common MPP of these strings. The optimum operating points of the strings from east-west systems can vary tremendously throughout the day. The greatest difference is in the morning and evening hours. The time when the sun rises is the period when the highest irradiance is recorded on the modules aligned to the east, whereas by contrast, the west-facing strings are still receiving little irradiance. This difference gradually lessens in the course of the day. At midday, the operating point of both orientations is about the same. In the afternoon hours, the difference between the optimum operating point of the east and west-facing strings increases again.
The graphic below compares an east-west system implemented with a single MPP tracker (olive green line) with a system where the east-facing (blue) and west-facing side (orange) have each been installed on an individual MPP tracker. The example reflects a typical morning scenario for an east-west system. As you can see, in the east-facing string (blue) the optimum operating point is 740 V. In the orange, west-facing string where production is somewhat lower in the morning, this is 720 V. If you look at the olive green string, that shows an east-west system combined on a single MPP tracker, it is clear to see that the “high” string is being operated in its MPP, and the “low” string is being operated a little outside its MPP. However, because there is so little deviation, the effect on the total energy yield is insignificant (see section 5.1).
![]()
Figure 10: MPP solar tracker behavior in an east-west system in the morning (09:00)
6.1 Lower costs with one MPP tracker
As described in section 4, it is possible with east-west systems to rely on an inverter of a lower power category, thus actively saving on initial costs. But PV projects not only use inverters and modules, there are many other, smaller components also making an important contribution to the overall system. This includes ensuring that the individual inverters operate safely, using surge protection devices (SPD) installed for each MPP tracker. The more MPP trackers there are available, the more SPDs are required. Inverters with only one MPP tracker therefore need fewer components, and consequently BOS costs are lower.
Along with cost savings at component level, a single tracker also has a positive effect on the yield of the photovoltaic system. This is due to the positive impact on inverter capacity utilization.
6.2 Positive impact on efficiency
An inverter operates at a certain efficiency. This efficiency varies, however, depending on utilization of inverter capacity. It is clear from the Fronius Tauro example that the range of greatest efficiency is not achieved by operating at full capacity.
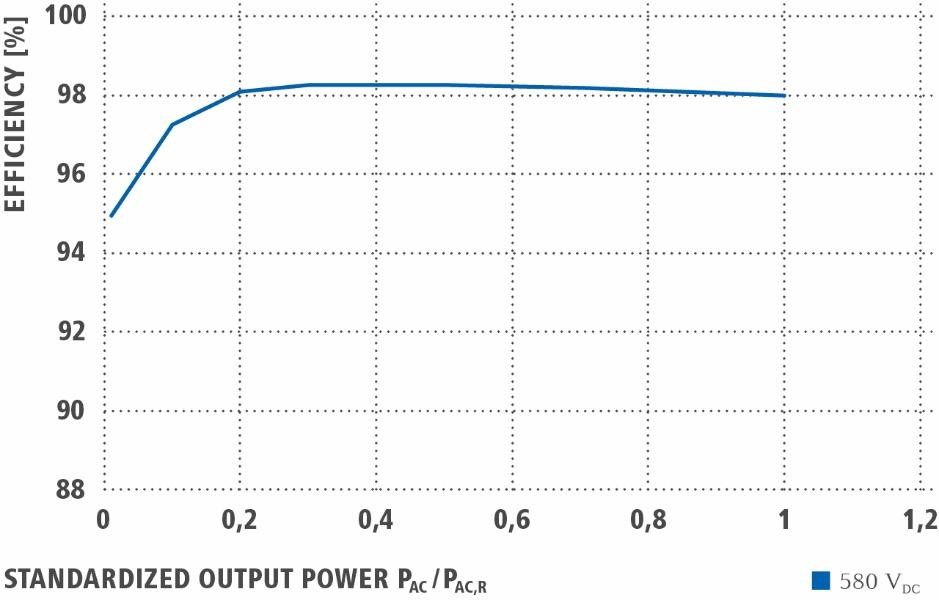
Figure 11: Fronius Tauro efficiency
The diagram shows that the inverter is more efficient at 50% capacity utilization than at full capacity. This is down to the physical aspects of inverter construction.
So, it is generally more efficient to operate the inverter long-term at a lower load than in the short term at full capacity. Balanced utilization of inverter capacity keeps electronic components at a consistently low temperature, protecting the individual parts and the device. This also has a positive effect on the service life of the inverter.
Long-term utilization of inverter capacity outside the full-load range can easily be realized by an east-west orientation on one MPP tracker. If east-facing and west-facing strings are installed on one MPPT, power is
distributed throughout the entire day and optimum efficiency is achieved. In large-scale PV systems, if the east-facing strings were to be installed to one inverter with an MPPT and the west-facing strings to a different inverter, the devices are more likely to operate in the full-load range.
This behavior is easily explained by means of the graphic below. A photovoltaic system aligned to the south (green) achieves the highest yield peaks at full irradiance around midday. The inverter must work hardest in this range. As a result, the inverter operates in the full-load range.
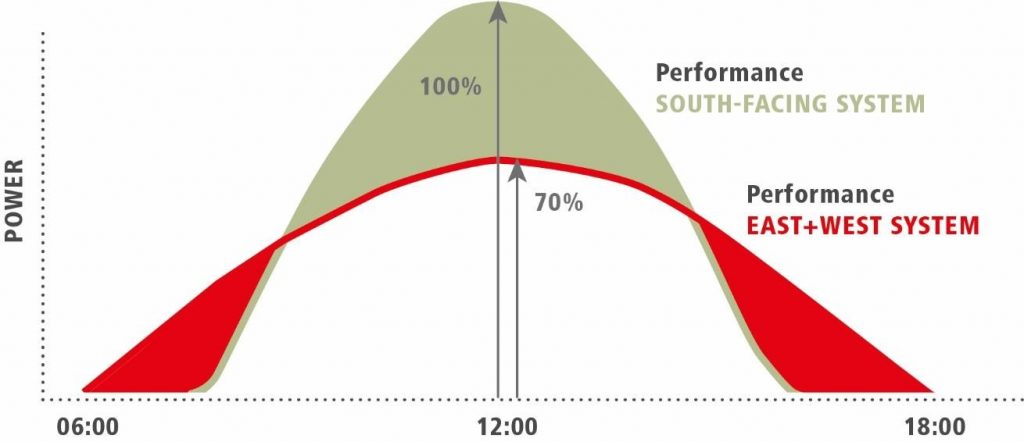
Figure 12: Utilization of inverter capacity in east-west and south-facing systems
In the east-west system (red) on the other hand, energy production is uniformly distributed automatically, because of the orientation. The inverter of the east-west system therefore only operates in the full-load range rarely, if at all. The better distribution of energy production throughout the day means that the inverter of the east-west system operates in a better efficiency range. This improved efficiency leads to a better yield result, which would also cancel out any marginal mismatch losses due to the east-west orientation.
7 CALCULATION EXAMPLE
This section contains a number of examples, the results of which are calculated using PV*SOL software. In each PV system example, an inverter with the relevant east-facing modules plus an inverter with the relevant west-facing modules (“separate MPPT”) are compared to a system where the east-facing and west-facing strings are connected with two inverters (“common MPPT”). This should simulate a comparison showing an east-west system, where firstly the east and west-facing strings have been implemented with one MPP tracker, and secondly with more than one MPP tracker. The total energy yield is then compared.
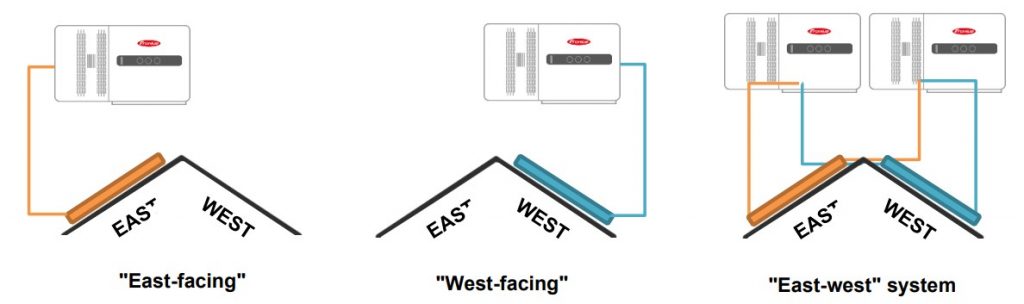
Figure 13: Visualization of scenario examples
7.1 Example A: without oversizing
Shown below is a comparison between two system examples with Tauro Eco and east-west orientations in an identical DC/AC power ratio.
| “EAST-FACING” SYSTEM | “WEST-FACING” SYSTEM | “EAST-WEST” SYSTEM | |
|---|---|---|---|
| PV MODULES | Jinko Tiger Pro JKM550M-72HL4-(V) | Jinko Tiger Pro JKM550M-72HL4-(V) | Jinko Tiger Pro JKM550M-72HL4-(V) |
| ALIGNMENT | East | West | East/west |
| TILT ANGLE | 10° | 10° | 10° |
| PV MODULES PER STRING | 18 | 18 | 18 |
| NUMBER OF STRINGS | 10 | 10 | 10 east facing / 10 west facing |
| STRING CONFIGURATION | 10 parallel | 10 parallel | 5 parallel west facing & 5 parallel east facing on 1 inverter |
| GENERATOR OUTPUT | 99 kW | 99 kW | 198 kW |
| INVERTER | 1xTauro Eco 100-3-D | 1xTauro Eco 100-3-D | 2xTauro Eco 100-3-D |
| Table 1: Parameter examples, DC/AC ratio 1:1 | |||
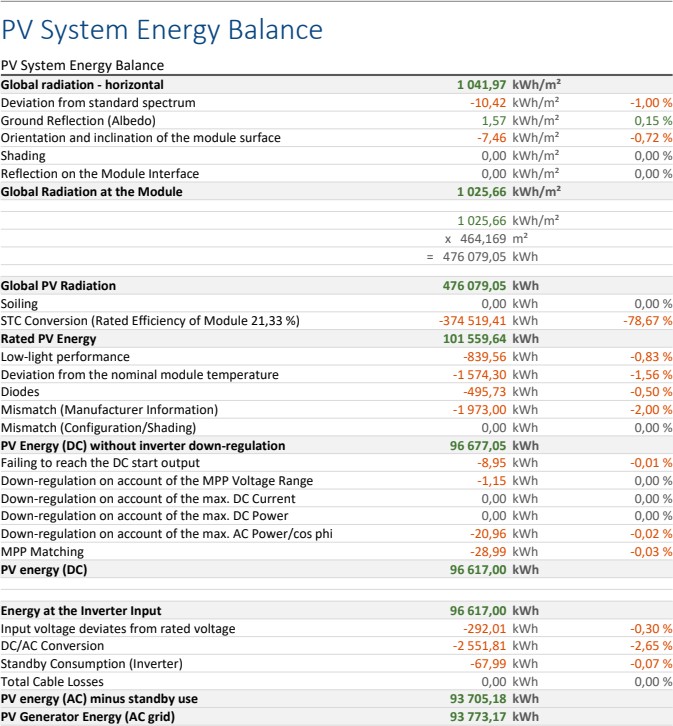
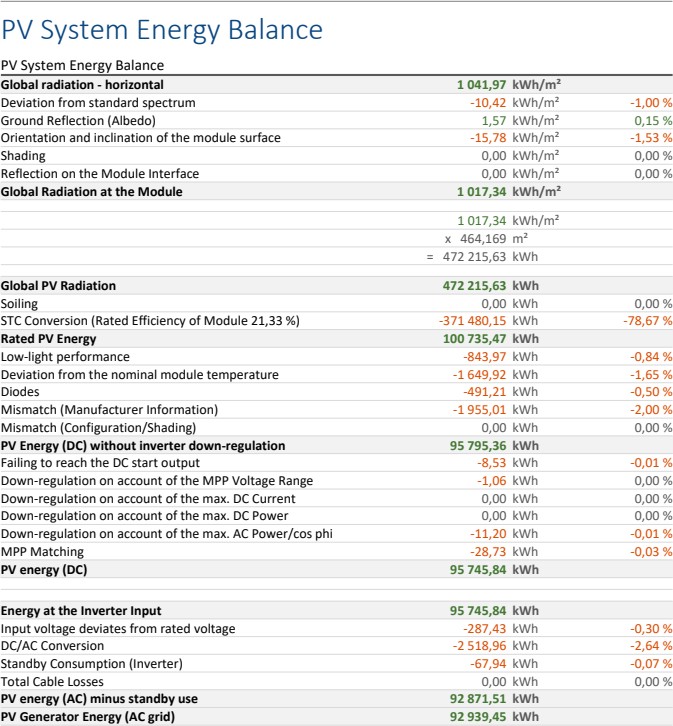
The results from PV*SOL of three calculation examples with a DC/AC ratio of 1:1 are shown in the table below. Please refer to the appendix for details of the calculation.
| East-facing system A | West-facing system A | East-west system A | ||||
|---|---|---|---|---|---|---|
| Parameter | [in kWh] | [as %] | [in kWh] | [as %] | [in kWh] | [as %] |
| Mismatch (configuration/shading) | 0.0 | 0.00 | 0.0 | 0.00 | 194.97 | 0.10 |
| Conversion loss (DC/AC) | 2,551.81 | 2.65 | 2,518.96 | 2.64 | 4,920.26 | -2.57 |
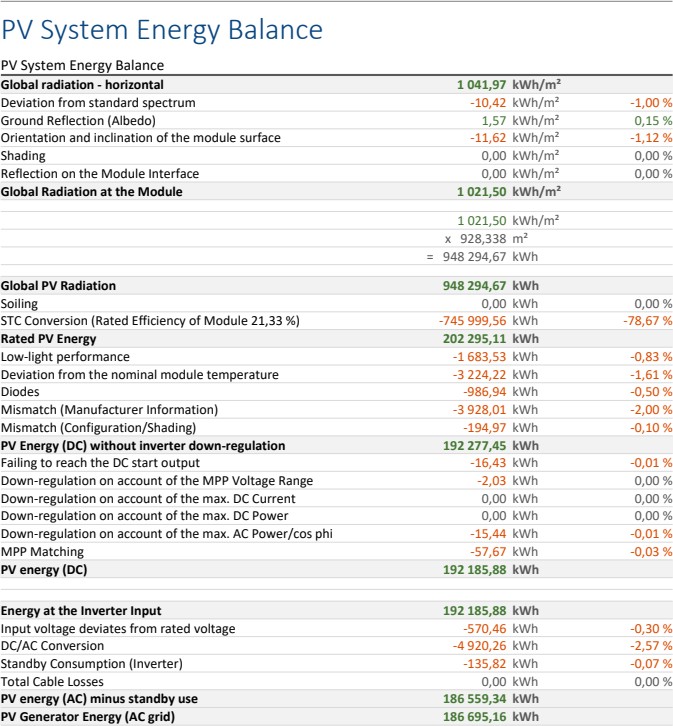
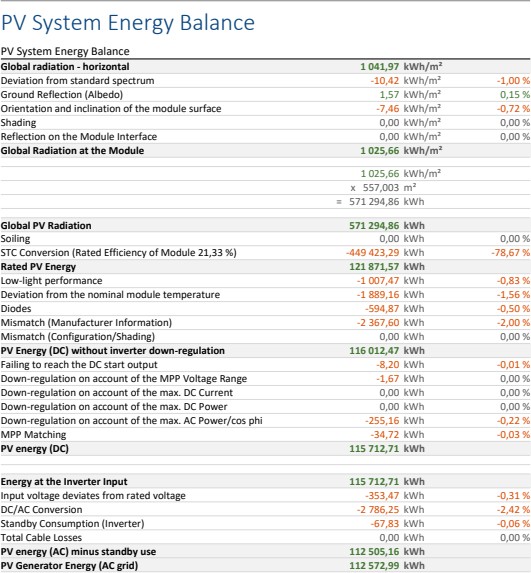
| PV generator energy yield (AC grid) | 93,773.17 kWh | 92,939.45 kWh | 186,695.16 | |||
| Table 2: Comparative PV*SOL calculation, DC/AC 1:1 | ||||||
The PV*SOL calculations shown here are not expected to show any mismatch losses, either in an entirely east-facing system or in a west-facing system. According to PV*SOL, the PV system aligned to the west produces a slightly lower yield compared to the east-facing system. This is due to the location and the outside temperature. The conversion losses are an important factor, and are higher in both the east-facing and west-facing systems compared to the east-west system. This factor depends on how efficiently the inverter is operating. Mismatch losses of 0.1% can be identified in the east-west system. However, the lower conversion loss of the east-west system makes up for the mismatch loss.
To obtain a comparable system on the basis of the data from PV*SOL, the calculated data from the east- facing system and the west-facing system are added together and contrasted with the east-west system.
| Calculation example | Yield |
| East-facing system + west-facing system | 186,712.64 kWh |
| East-west system | 186,695.16 kWh |
| Difference | -17.48 kWh |
| Table 3: DC/AC 1:1 result | |
The calculation shows that with a balanced DC/AC generator ratio (no oversizing), the individual systems generate 17.48 kWh more per year. This means that a system according to the parameters mentioned in the examples would only produce 0.01% more yield than if you were to connect the east and west-facing strings to two separate MPP trackers. This result clearly shows that mismatch losses in systems without oversizing are virtually made up for by the greater efficiency that results from having a single MPP tracker, and so play no role in planning.
7.2 Example B: oversizing of 120%
Shown below is a comparison between two system examples with Tauro Eco and east-west orientations in a 1.2:1 DC/AC ratio.
| “EAST-FACING” SYSTEM | “WEST-FACING” SYSTEM | “EAST-WEST” SYSTEM | |
|---|---|---|---|
| PV MODULES | Jinko Tiger Pro JKM550M-72HL4-(V) | Jinko Tiger Pro JKM550M-72HL4-(V) | Jinko Tiger Pro JKM550M-72HL4-(V) |
| ALIGNMENT | East | West | East/west |
| TILT ANGLE | 10° | 10° | 10° |
| PV MODULES PER STRING | 18 | 18 | 18 |
| NUMBER OF STRINGS | 12 | 12 | 12 east facing / 12 west facing |
| STRING CONFIGURATION | 12 parallel | 12 parallel | 6 parallel west facing & 6 parallel east facing on 1 inverter |
| GENERATOR OUTPUT | 118.8 kW | 118.8 kW | 237.6 kW |
| INVERTER | 1xTauro Eco 100-3-D | 1xTauro Eco 100-3-D | 2xTauro Eco 100-3-D |
| Table 4: Parameter examples, DC/AC ratio 1.2:1 | |||
The results from PV*SOL of three calculation examples with a DC/AC ratio of 1.2:1 are shown in the table below. Please refer to the appendix for details of the calculation.
| East-facing system B | West-facing system B | East-west system B | ||||
|---|---|---|---|---|---|---|
| Parameter | [in kWh] | [as %] | [in kWh] | [as %] | [in kWh] | [as %] |
| Mismatch (configuration/shading) | 0.0 | 0.00 | 0.0 | 0.00 | -233.96 | -0.1 |
| Conversion loss (DC/AC) | -2,786.25 | -2.42 | -2,748.61 | -2.4 | -5,369.9 | -2.34 |
| PV generator energy yield (AC grid) | 112,572.99 kWh | 111,617.66 kWh | 224,236.42 kWh | |||
| Table 5: Comparative PV*SOL calculation, DC/AC 1.2:1 | ||||||
The PV*SOL calculation shows that there are no mismatch losses in either the entirely east-facing system, or in the west-facing system. According to PV*SOL, the west-facing system produces slightly less energy than the east-facing system. This is due to the higher temperatures in the afternoon influencing the power of the PV modules. Again, it is interesting to compare the DC/AC conversion factor: in the east-facing and west-facing systems, this is higher than in the east-west system. In the east-west system, on the other hand, there are mismatch losses of 0.1%. However, the lower conversion loss of the east-west system makes up for the mismatch loss.
To obtain a comparable system on the basis of the data from PV*SOL, the calculated data from the east- facing system and the west-facing system are added together and contrasted with the east-west system.
| Calculation example | Yield |
|---|---|
| East-facing system + west-facing system | 224,190.65 kWh |
| East-west system | 224,236.42 kWh |
| Difference | 45.77 kWh |
| Table 6: DC/AC 1.2:1 result | |
The calculation shows a difference of 45.77 kWh per year in favor of the east-west system with just one MPP tracker. This result clearly shows that mismatch losses in systems with oversizing of 20% are made up for by increased efficiency, and so play no role in planning.
7.3 Example C: Oversizing of 140%
Shown below is a comparison between two system examples with Tauro Eco and east-west orientations in a 1.4:1 DC/AC ratio.
| “EAST-FACING” SYSTEM | “WEST-FACING” SYSTEM | “EAST-WEST” SYSTEM | |
|---|---|---|---|
| PV MODULES | Jinko Tiger Pro JKM550M-72HL4-(V) | Jinko Tiger Pro JKM550M-72HL4-(V) | Jinko Tiger Pro JKM550M-72HL4-(V) |
| ALIGNMENT | East | West | East/west |
| TILT ANGLE | 10° | 10° | 10° |
| PV MODULES PER STRING | 18 | 18 | 18 |
| NUMBER OF STRINGS | 14 | 14 | 14 east facing / 14 west facing |
| STRING CONFIGURATION | 14 parallel | 14 parallel | 7 parallel west facing and 7 parallel east facing on 1 inverter |
| GENERATOR OUTPUT | 138.6 kW | 138.6 kW | 277.2 kW |
| INVERTER | 1xTauro Eco 100-3-D | 1xTauro Eco 100-3-D | 2xTauro Eco 100-3-D |
| Table 7: Parameter examples, DC/AC ratio 1.4:1 | |||
The results from PV*SOL of three calculation examples with a DC/AC ratio of 1.4:1 are shown in the table below. Please refer to the appendix for details of the calculation.
| East-facing system C | West-facing system C | East-west system C | ||||
|---|---|---|---|---|---|---|
| Parameter | [in kWh] | [as %] | [in kWh] | [as %] | [in kWh] | [as %] |
| Mismatch (configuration/shading) | 0.0 | 0.00 | 0.0 | 0.00 | -272.95 | -0.10 |
| Conversion loss (DC/AC) | -3,061.76 | -2.3 | -3,020.02 | -2.28 | -5,922.24 | -2.23 |
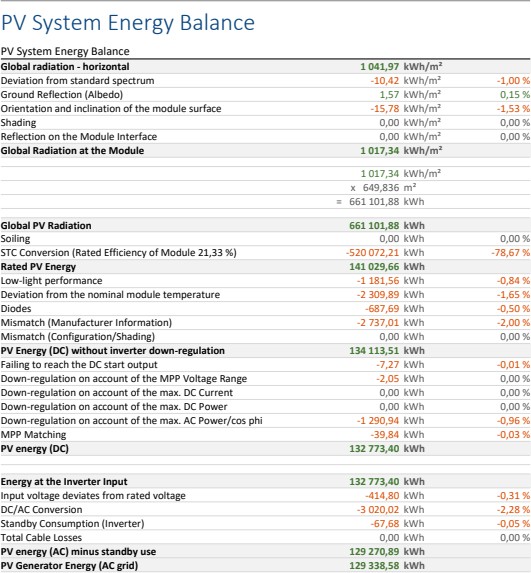
| PV generator energy yield (AC grid) | 130,286.34 kWh | 129,338.58 kWh | 260,082.91 kWh | |||
| Table 8: Comparative PV*SOL calculation, DC/AC 1.4:1 | ||||||
According to the PV*SOL calculation, there are – as expected – no mismatch losses either in the entirely east-facing system or in the west-facing system. The west-facing system produces slightly less energy than
the east-facing system according to the calculation, due to the weather and the higher temperature in the afternoon.
It is interesting to compare the DC/AC conversion factor, which is higher in the east-facing and west-facing systems than in the east-west system. In the east-west system, the mismatch losses are 0.11%. However, the lower conversion loss of the east-west system makes up for the mismatch loss.
To obtain a comparable system on the basis of the data from PV*SOL, the calculated data from the east- facing system and the west-facing system are added together and contrasted with the east-west system.
| Calculation example | Yield |
|---|---|
| East-facing system + west-facing system | 259,624.92 kWh |
| East-west system | 260,082.91 kWh |
| Difference | +457.99 kWh |
| Table 9: DC/AC 1.4:1 result | |
If you compare the two system examples in PV*SOL, the east-west system where both strings are connected to a common MPPT produces 457.99 kWh more per year. This result clearly shows that mismatch losses in systems with 40% oversizing are made up for by greater efficiency, and so play no role in planning. It is also obvious that installing the two directions on two MPP trackers can also achieve an advantage in terms of yield, especially with a high degree of oversizing.
8 SIMULATION RESULTS
The preceding simulations show example scenarios with different DC/AC ratios.
The results of the above calculation examples are collected together and presented once more in the table below.
| Oversizing | “1 MPPT each” (east-facing system; west- facing system) |
“1 common MPPT” (east-west system) |
Difference | |
| 0% | 186,712.64 kWh | 186,695.16 kWh | -17.48 kWh | 0.01% |
| 20% | 224,190.65 kWh | 224,236.42 kWh | 45.77 kWh | 0.02% |
| 40% | 259,624.92 kWh | 260,082.91 kWh | 457.99 kWh | 0.176% |
| Table 10: Comparison of calculation example results | ||||
The PV*SOL calculations clearly show that in all three calculation scenarios, the example system with a common tracker – the east-west system – produces a virtually identical or better result than the system with separate trackers it is being compared with. This is due to the utilization of capacity and efficiency of the inverter. The calculations also show that the more the DC/AC ratio is oversized, the greater the yield in the east-west system compared to the east-facing system and the west-facing system. This means, especially with oversized photovoltaic systems, that it makes economic sense to install both directions to a common MPPT. Mismatch losses are made up for by the greater efficiency that this achieves, and so play no role in planning.
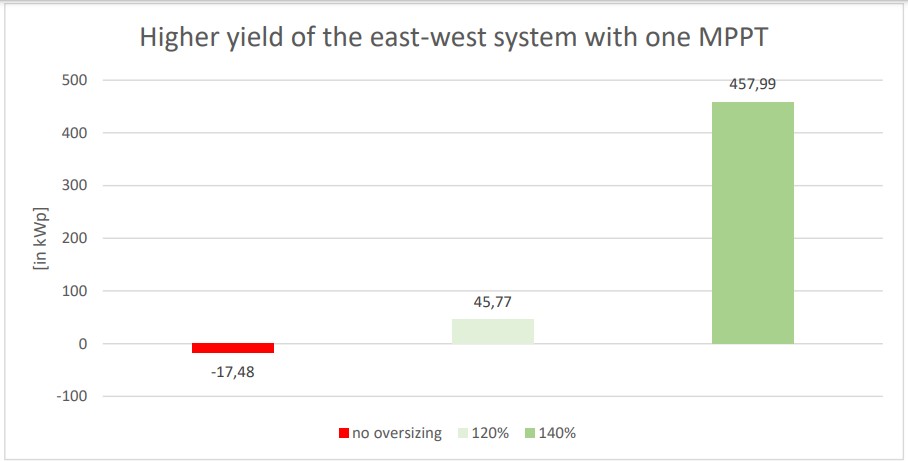
Figure 14: Higher yield of the east-west system with 1 MPPT in relation to oversizing
9 CONCLUSION
It was possible in the preceding sections to show the profitable aspects of east-west systems compared to south-facing systems. We were able to demonstrate that an east-west orientation, unlike a south orientation, offers more space for more generator output on certain roofs and surfaces, so that a higher total yield is always possible with this alignment. Also, east-west orientations with 1 MPP tracker actively save costs, both for inverters and for components such as the surge protection device. We also explained that east-west systems provide an ideal basis for a high self-consumption rate, with the commercial photovoltaic system paying for itself more quickly as a result.
The preceding calculations disprove the theory that strings facing different directions but nevertheless installed on a common MPPT negatively affect each other, and would thus diminish the total yield of the system. The results of the PV*Sol calculations show that an east-west system realized with just one MPPT per inverter can even be more profitable than an east-west system with several trackers.
It was possible to demonstrate that inverter utilization also significantly influences the total yield of the PV system. From an efficiency point of view, east-west systems with one MPP tracker make optimum use of the inverters. This shows that it also makes sense to switch to one inverter for each of the east and west-facing strings in larger systems, where several inverters are installed in an array. As a result, the loading on the inverter is better and greater efficiency is achieved, which ultimately leads to more yield.
The inference, that an east-west system with one tracker always produces more yield than one with several MPP trackers is not universally valid, however. External influencing factors such as location, insolation, tilt angle, the inverter itself, and many other factors are crucial in determining the result.
However, it is evident from the calculation examples above that the energy yield of east-west alignments implemented with one MPP tracker are on a par with those with several MPP trackers, and there are certainly no anticipated losses in comparison.
East-west systems implemented with one MPP tracker not only produce maximum yield, they also save on the cost associated with having several MPP trackers.
10 APPENDIX
East-facing system A
West-facing system A
East-west system A
East-facing system B
East-west system B

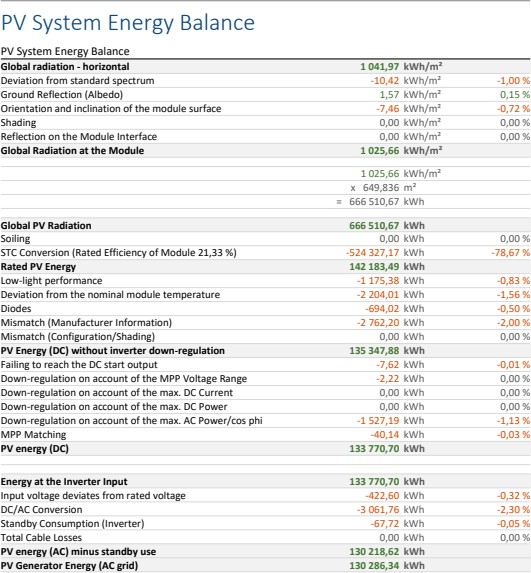
West-facing system C
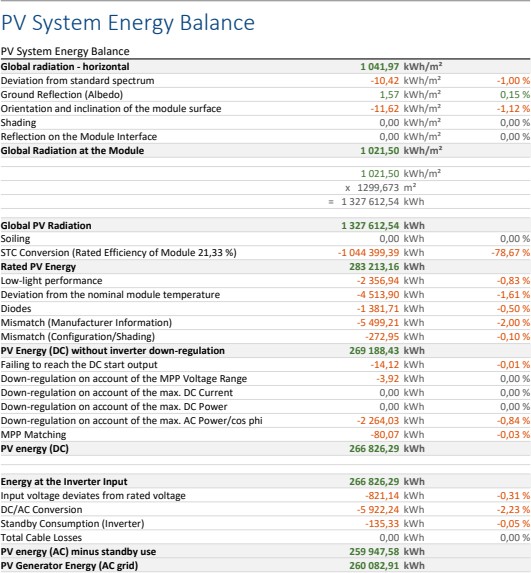
East-west system C